
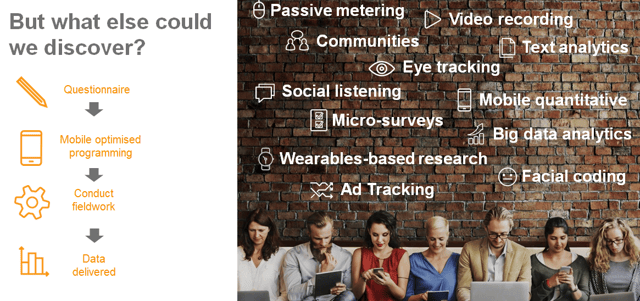
Technology is now part of our everyday lives- in how we communicate with friends, family, colleagues, how we function in all facets. But how can we leverage technology to gain deeper insights and benefit users of market research?
We took a standard mobile quant survey and looked at how adding layers of different consumer data could help build a fuller picture and understanding of the audience. Working with a large Singaporean telco, we were looking to find out how people watch content and why, if they subscribe to Pay TV packages and ultimately how they could boost their customer base.
Stage 1: Mobile Optimised Quant Survey
Normally, we would take a questionnaire, recommend enhancements, programme for mobile optimisation, field the 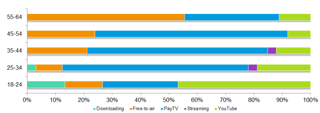 survey and share a data file. This approach identified that Pay TV is used by a quarter of respondents, less so by 18-24 year old who are turning to YouTube and downloading of shows . So the ‘who’ was identified and we could have started to ask question after question in the same survey. But this would risk respondent fatigue and one dimensional data so for an inside view of the audience, there are many technology options to build on so we turned to these.
Stage 2: Video Responses
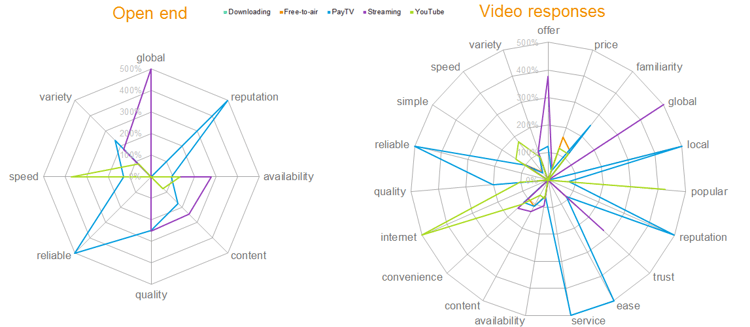
98% of the surveys that come to us have an open end, whereas less than 5% incorporate a video response question. Switching out the open-end question for video response gave participants choice and the chance to answer more openly and naturally. On average, open ends provide 4-5 words; however, video rockets to 60 words. Although some of this can be redundant (e.g., umm and aah), video also allows you to gather extra details such as where they are, what they are doing around the house, who they are with etc. This results in much richer findings, as well as a chance to see the consumers behind the comments and create showreels to include in presentations which bring the results to life. For this project, the standard open end typing response gave eight descriptions, but video offered 19 and developed a deeper understanding of the attributes of Pay TV that didn’t appeal to the audience, notably the bundle, both offer and price, variety and convenience which were not so apparent from the OE feedback.
Stage 3: Facial Coding Analysis
We had now determined the ‘who’ and the ‘why’ (or rather, ‘why not’) but there was much more to explore. Next, facial 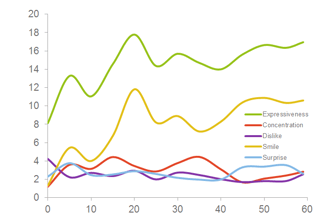 coding was added. Rather than relying on recall or descriptors of feelings towards an advert that a standard survey would use, this allowed for real-time analysis of respondents’ reactions and a confidence in the data. The score ranked 2/74 in its category (60 second advertisements), peaks were seen at the 20 second and 60 second marks for smile and expressiveness but where these dipped the concentration was up, suggesting that the ad narrative was strong and viewers left it with a positive sentiment. At this point, the survey ‘who’ and the video ‘why’ were furthered with the ‘how’ of the types of emotions to use in engagement tactics of advertising and marketing to this audience.
Stage 4: Social Listening
To broaden the spectrum, we turned to social media to find out what people are sharing on social media (because this is a common platform for portraying our thoughts, beliefs and activities today. Tapping into this we searched keywords to identify what was being mentioned. First we found that PayTV as a channel of viewing was not widely discussed on social media. But when you take a step back that makes good sense- wouldn’t you be more likely to talk about the 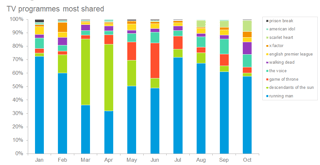 programme rather than the device or channel you’re watching it through? I know I would. So, we turned our attention to specific programmes. It was noticed that two programmes had the major share of voice here. But mentions alone can be misleading, we needed to assess if the sentiments behind this were positive or negative. In doing so, the third most mentioned had the greatest share of negative mentions which was double that of its own positive mentions. We could have taken this to the client but this is where the nuances of the programmes came into play and looking at the words and indeed the show itself was key. This particular programme was Game of Thrones, which thrives on its controversial, gruesome content. If leveraged correctly, this would give the client three programmes to play up and focus on to draw in consumers.
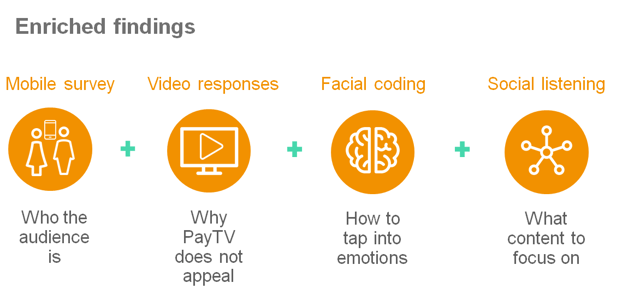
So we now had a clear picture of who their audience is, why a Pay TV subscription didn’t appeal as a means to consume content, how to tap into emotions to attract the audience and what specific content to focus on to attract subscribers. This level of detail was far enhanced from a standard survey and gave actionable data to the client to move swiftly on. The moral of the story? Technology is there to be used, adopt the appropriate technology for your particular needs and you can reach a new level of consumer understanding to drive your brand or client forward.