
Insurance is applicable across many facets of consumers lives and therefore for many groups. It is an overcrowded space in Australia with multiple providers from banking institutions extending their offer to small online newcomers.
Lightspeed's January 2017 study of 500 Australians (Nat Rep) set out to better understand consumer attitudes around insurance types, owners and the competitive landscape to aid providers as they strategise for the future. The study took our common approach, being programmed and designed as mobile first (LOI < 10 mins, 15 questions and two open-ended questions on with the option for video response). Perhaps part of the reason that we talk little about insurance is because the topic is not as inspiring as others. To help engage panellists, some areas require extra commitment to an enjoyable survey experience. For this reason, we utilised a mobile first design to allow access via the device of the respondent and with more enticing question formats that are both fun and simple to use, as well as a video response question to help keep variety for the respondent in a different way of answering.
Insurance Types
The obvious starting point was to focus on who is buying what when it comes to insurance. We found that almost 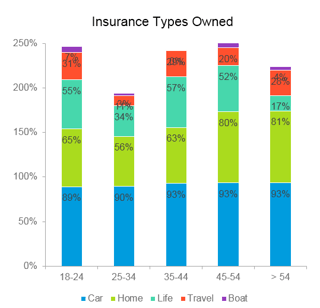 everyone owned car insurance. House insurance membership was highest in the older age bracket and interestingly Life insurance membership was highest in 35-44 age bracket, followed by 18-24 age bracket and least in the > 54 age bracket.
Insurance Providers
We then looked at providers. The Top 3 identified here were MLC, AMP and TAL. When broken down by age bracket the data showed us how varied provider choice is. Furthermore, we found that fewer providers make up 50% of market share in the young age bracket (18-24) compared to the older age brackets which are more dispersed.
Top Insurance Providers by Age
|
18-24 |
25-34 |
35-44 |
45-54 |
>54 |
|
Bupa (16%) |
NAB (12%) |
Medibank (14% |
MLC (10%) |
SGIO (12%) |
|
Coles (16%) |
CommInsure (11%) |
SGIC (11%) |
QBE (9%) |
APIA (11%) |
|
Allianz (15%) |
GIO (9%) |
AMP (8%) |
Westpac (9%) |
QBE (7%) |
|
Youi (15%) |
Woolworths (8%) |
CGU (8) |
Zurich (9%) |
Zurich (7%) |
|
|
|
TAL (8%) |
|
|
Insurance Premiums
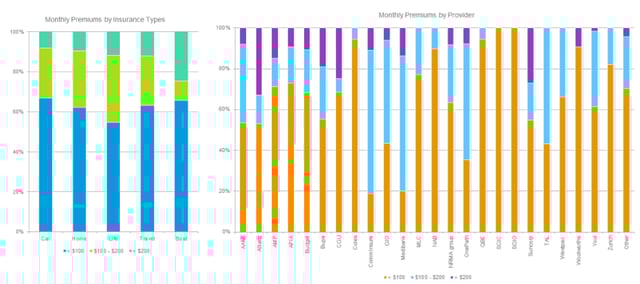
For the majority of the insurance types Premiums were less than $200 per month, with the highest percentage paying less than $100 per month. Life insurance had the largest number of $100 - $200 per month. The majority of insurance providers sat in the premiums under $100 category, along with many others.
Recommendation
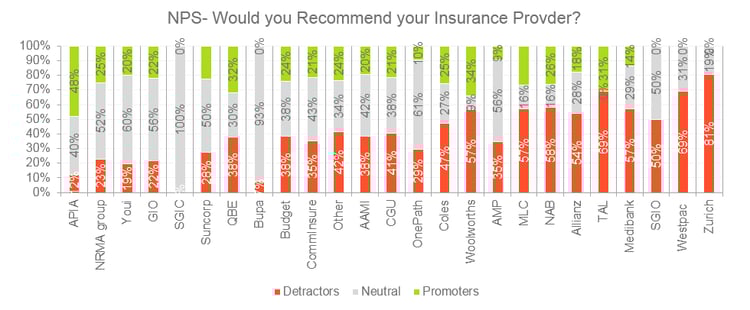
Looking at NPS revealed a hard position for Insurance Providers, with the bulk of providers falling primarily into detractors or neutral categories. The findings show that only APIA has promoters that considerably exceed the detractors.
Not only is this convoluted marketplace hard to navigate for providers but consumers too must be confused in such a space.
